When a company experiences a disruption to its digital infrastructure, the business interruption and restoration costs that it causes can undermine revenue and profitability objectives. Modern business operations need to rely on a resilient infrastructure consisting of data centers, network connectivity, and the Domain Name System (DNS) to maintain availability for internal applications and customer-facing websites and services.
Increasingly, attackers target digital infrastructure because of a business’s dependency on it, while security teams work tirelessly to mitigate risk and protect sensitive data and assets by relying on the availability and performance of the underlying infrastructure. For insights into Distributed Denial of Service (DDoS) attacks, security teams need current threat intelligence from experts who understand the Tactics, Techniques, and Procedures (TTPs) that threat actors use to evade detection and mitigation, such as carpet-bombing attacks.
Every month, Vercara reports on trends across three critical infrastructure domains:
- Distributed Denial of Service (DDoS) attacks
- Domain Name Service (DNS) traffic
- Web Application Firewall (WAF) attacks
This monthly roundup of reports provides information to help defenders manage their infrastructure, applications, and cloud-based security solutions.
DDoS: Attackers Refine Tactics to Bypass Traditional Defenses
Overall, DDoS attacks saw a 12.24% month-over-month decrease in number. This likely relates to attackers refining their tactics, leveraging high-bandwidth assaults and carpet-bombing techniques to bypass traditional defenses.
Of the data gathered, the following highlights offer insights:
- 4,372 DDoS attacks detected, with Vercara’s monitoring and mitigation preventing approximately 639.37 hours of downtime
- Largest attack peaking at 686.69 Gbps and consisting of 66.65 million packets per second (Mpps), reinforcing the growing threat of high-intensity attacks.
- A 550% increase in mega attacks (100+ Gbps), highlighting a shift toward large-scale disruptions.
- 128.57% increase in packet-based attacks in the 250-300K pps range, suggesting an increased reliance on amplification-based techniques
For a deeper dive, check out the DDoS Analysis Report.
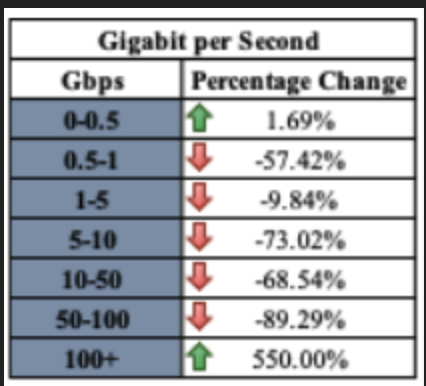
Carpet Bombing Is Back Again
When malicious actors target numerous IP addresses with smaller-sized attacks, called carpet bombing, they intend to evade detection and make mitigation more difficult. Small attacks between 0-0.5 GBPS accounted for 3,671, accounting for 84.04% of all observed attacks. Additionally, 58.15% of attacks were in the 0-10K pps range.
Carpet bombing attacks account for 77.63% of the February DDoS attacks observed.

Comparing month-to-month changes notes the following:
- Small attacks (0-0.5 Gbps): 1.69%
- Mega Attacks (100+ Gbps): -550%
Since most organizations typically set alert triggers at higher gigabit levels, carpet bombing DDoS attacks create mitigation challenges because the threat actors:
- Remain under alerting thresholds
- Flood networks
- Rotate target IPs and destinations
- Rotate targeting method
Top 3 Attack Vectors Shift A Bit
The TCP ACK vector overtook Total Traffic in the number one spot. TCP ACK floods target the way servers manage connections. By sending a massive number of spoofed ACK packets, they force the server to expend resources searching for non-existent connections, eventually exhausting its capacity to handle legitimate traffic.
The top four attack vectors for February were:
- TCP ACK: 42.05%
- Total Traffic: 30.89% (compared to January’s 41.88%)
- UDP: 10.9% (compared to January’s 23.91%)
- TCP SYN/ACK: 5.24%
68.62% of observed DDoS attacks consisted of one DDoS vector, while 31.38% consisted of two or more.
Top 3 Industries
The Online Gambling and Gaming industry showed up for the first time in February, coming in third place, along with the following two industries by percentage of events listed:
- Financial Services: 95.85% (compared to January’s 37.11%)
- IT/Technical Services: 2.65% (compared to January’s 19.25%)
- Online Gambling and Gaming: 0.69%
DNS: Steady Activity
Vercara Managed DNS noted a 7.50% decrease in overall web traffic for February, which makes sense as it is the shortest month of the year. However, the number of daily authoritative queries rose by 2.41%, underscoring the critical role DNS plays in supporting digital operations.
Vercara’s UltraDNS observed 29 DDoS attacks targeted against the platform in February, a 53.97% decline over January. However, with a peak attack reaching 209.86 Gbps and 22.80 million packets per second (pps), attack size and complexity remain a concern.
For a deeper dive, check out the DNS Analysis Report.
IPv4 and IPv6 trends
Overall, February followed in January’s footsteps with the Top 3 DNS Query types:
- A Record
- AAAA record (quad-A)
- Name Server (NS)
The consistent percentage of quad-A record queries indicates a continued shift toward IPv6 and its additional security benefits.
Notably, the Responsible Person (RP) resource record experienced the biggest increase last month, with a 76.20% increase compared to January. The RP record is used to specify the email addresses of individuals responsible for a domain name/zone.
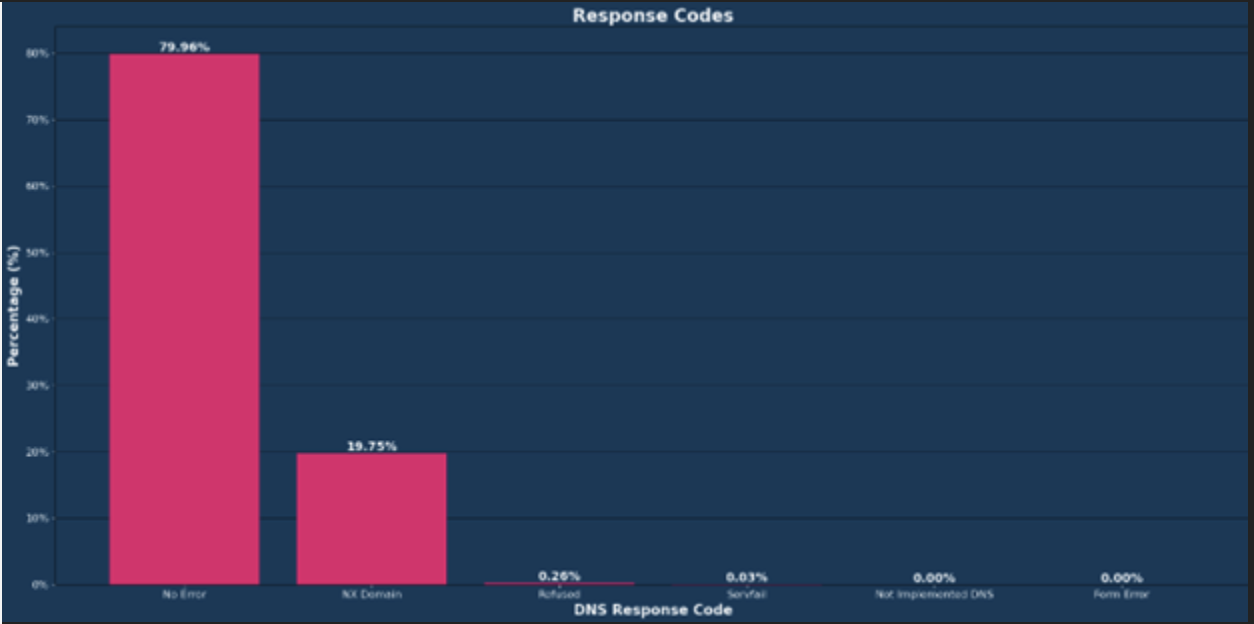
DNS Response Codes Remain Statistically Stable
The top two response codes remained the same month-over-month:
- “No Error”: most prevalent response code at 79.96%, a 6.75% month-over-month decrease
- “NXDomain”: 19.75%, a 10.09% month-over-month decrease
The NX Domain response code can indicate a misconfiguration, attackers using DNS enumeration tools, or water torture DDoS attacks.
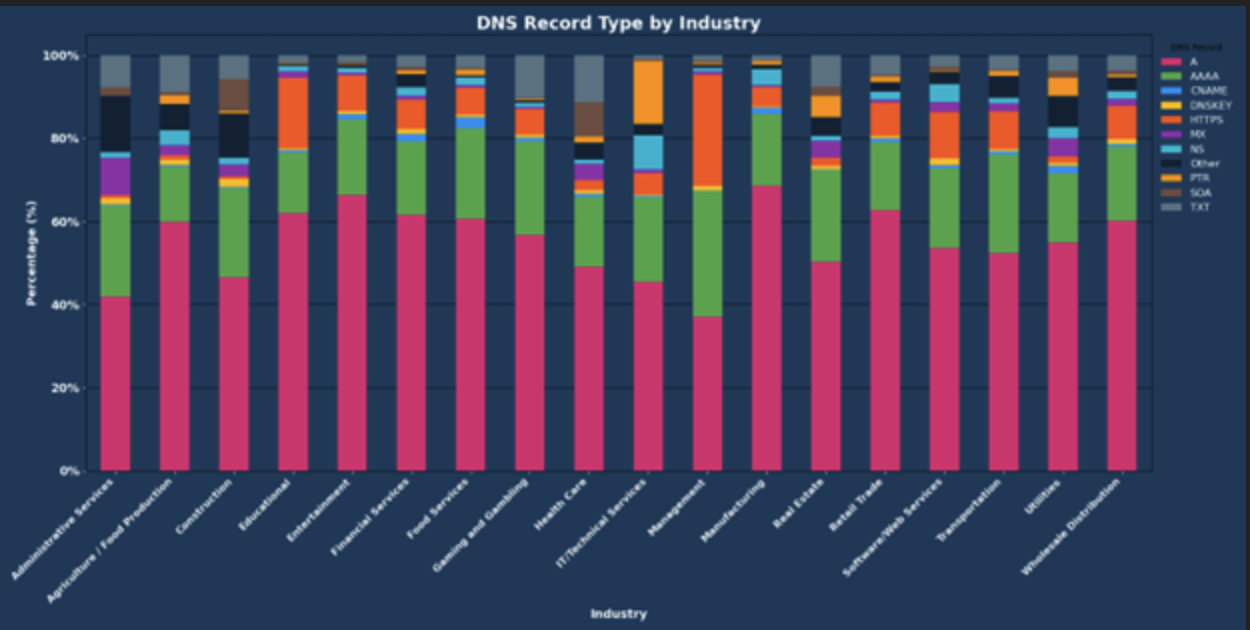
Industry sectors
Industry sectors continue to work on and improve their DNS management, with February’s report showing both wins and areas for improvement.
The DNS record-type queries provide insight into how the industry uses digital infrastructure. Some highlights include:
- Widespread requests for HTTPS records indicate an emphasis on secure web communications.
- Financial Services and Healthcare verticals show a moderate presence of TXT records, indicating a heightened emphasis on email authentication protocols like SPF or DKIM.
Software/Web Services and IT/Technical Services
These two industries received the most DNS queries, representing 80.24% of all DNS queries. Software/Web Services accounted for 49.37% while IT/Technical Services accounted for 30.87%. The number indicates the sectors’ extensive reliance on robust DNS services for:
- Web hosting
- Cloud services
- Technical operations
Additionally, the Software/Web Services industry had a significant presence of ‘No Error’ responses, indicating effective DNS management.
Manufacturing
The Manufacturing industry received the third most DNS queries, accounting for 12.90%. These query volumes may indicate the growing use of digital services, including Industrial Internet of Things (IIoT) devices.
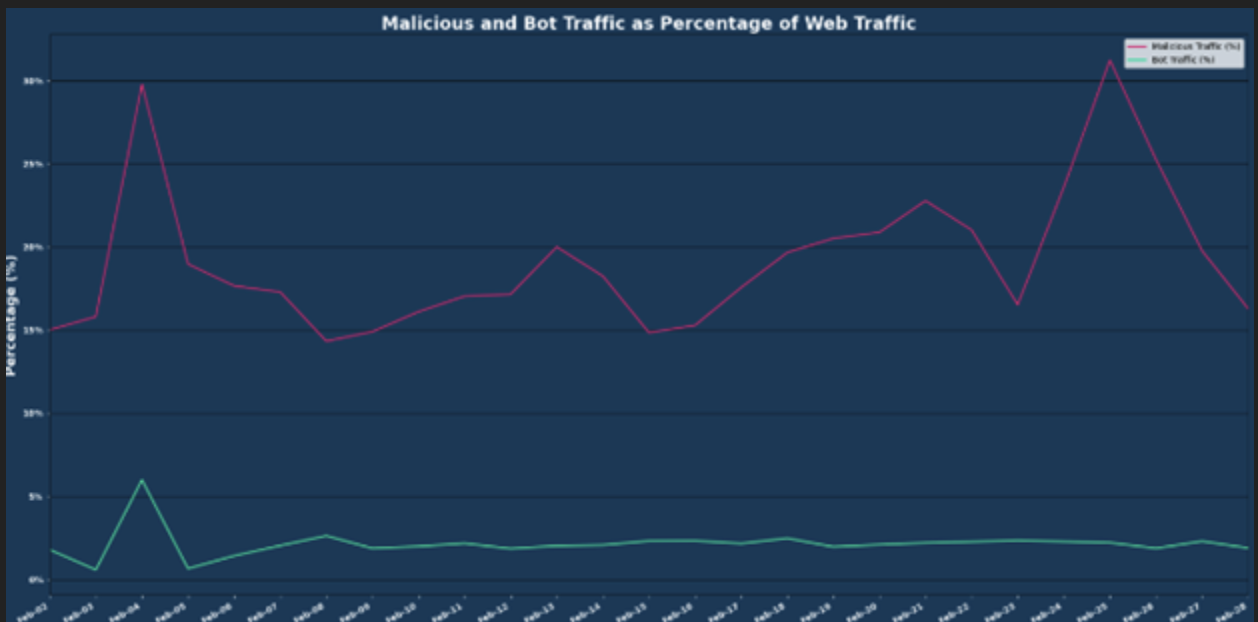
Web Application Firewall (WAF): Up, up…But Not Away
During February, Vercara UltraWAF processed over 646 million web requests, a 9.46% decrease compared to January. Of these requests, 19.41% were malicious and 2.13% were identified as bot traffic.
The Deny URL category showed a significant 334.13% increase. This rule or policy blocks access to specific URLs based on predefined security criteria to prevent malicious requests from reaching the application. By filtering out common attack destinations, the rule mitigates risk of attacks like SQL injection, cross-site scripting (XSS), or automated bot traffic.
Holding Statistically Steady
February’s data found:
- 7.9% increase in malicious activity compared to January
- 2.13% increase in the amount of bot traffic compared to January
Top 3: the More Things Change, the More They Stay the Same
Along with these overall increases, February showed additional changes:
- Cookie threat category remained most prevalent, accounting for 41.98% of malicious traffic
- Command Injection came in second, accounting for 24.61% of malicious traffic
- Invalid RFC threat came in third, accounting for 17.90% of malicious traffic

February Countermeasure of the Month
Our featured countermeasure this month is Device Fingerprint. This countermeasure allows UltraWAF to detect and block bots based on a JavaScript challenge. The JavaScript challenge looks at browser capabilities and compares them to the capabilities of the User-Agent that the browser reports in HTTP requests. Oftentimes, bots will claim to be a standard web browser but will fail the fingerprinting process because they do not support JavaScript and do not have a Document Object Model and other resources that are common to that browser version. Bots that fail or do not complete the fingerprinting process are blocked for subsequent requests.
Enabling Device Fingerprint is a straightforward process. Select the checkbox to enable the countermeasure, choose a response, and optionally choose an action. Save the policy, and you have added Device Fingerprint as a bot countermeasure.
Turnkey Cloud-based Security with Vercara
Vercara provides a turnkey, multilayered approach to security with UltraDNS, UltraDDoS Protect, and UltraWAF. With Vercara’s comprehensive suite of solutions, organizations gain advanced security capabilities, insights for informed decision-making, and improved resilience against cyber threats.
Contact our sales team to learn how Vercara’s suite of solutions can help defend your organization.