Metrics and performance indicators for managing digital infrastructure security enable continued business operations and continuity. Yet, many companies lack this insight into the threats facing their infrastructure, network, and applications. This visibility gap can be filled by a monthly roundup of reports from key vendors such as Vercara. This enables organizations to gain more insight into trends and risks, best practices for secure configurations, and the value that they receive from their cloud-based security solutions.
Every month, Vercara reports on trends across three critical infrastructure domains:
- Distributed Denial of Service (DDoS) attacks
- Domain Name Service (DNS) traffic
- Web Application Firewall (WAF) attacks
DDoS: Some shifts in perspective.
Overall, DDoS attacks saw a month-over-month decrease from June’s year-high records, especially in the quantity of carpet bombing attacks.
- 6,636 DDoS attacks were detected, an 88.28% month-over-month decrease compared to June 2024, more consistent with expectations
- 679 DDoS attacks observed on July 27, 2024, a 317.10% increase from the daily average, with most of these DDoS attacks targeting a Communication Service Provider
See the latest DDoS Analysis report for more details.
Carpet bombing attacks down, and unique DDoS attacks up.
Carpet bombing DDoS attacks spread smaller attacks over an entire target network block or multiple blocks to evade detection and make mitigation more difficult. They accounted for 40.46% of all July DDoS attacks, a decrease of more than half compared to June’s 85%.
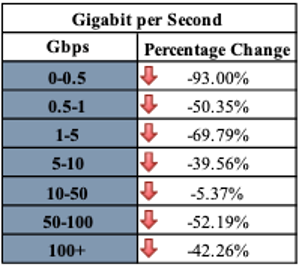
Tracking with the rest of the DDoS data, carpet bombing and mega attacks both experienced a month-over-month decrease:
- Small attacks (0-0.5 gbps): -93%
- Mega Attacks (100+ Gbps): -42.26%

For most organizations, carpet bombing DDoS attacks create mitigation challenges since organizations often set alert triggers at higher gigabit levels. However, in a carpet bombing DDoS attack, the threat actors:
- Remain under alerting thresholds
- Flood networks
- Rotate targeted IPs and destinations
- Rotate targeting DDOS vectors and methods
The longest carpet bombing attack occurred on July 21. It lasted 6 hours and 50 minutes and consisted of 63 attack waves.
Total traffic rises to the top.
Total Traffic as an attack vector regained its number one spot, while DNS amplification, the leading attack in June, fell to fourth place. However, the second, third, and fourth places for vectors were separated by less than one-half of one percent, making it a three-way tie.
The top four attack vectors for July were:
- Total Traffic: 32.14%
- UDP: 14.52%
- IP Fragmentation: 14.41%.
- DNS Amplification: 14.03%
Of note, 65.75% of observed DDoS attacks in June consisted of a single attack vector, which is similar to June’s 66.11%.
Top 3 attacked industries.
Communication service providers and financial services swapped spots compared to June 2024, with July’s top three industries by percentage of events becoming:
- Communication service providers: 41.79% (compared to June’s 25.10%)
- Financial Services: 30.45% (compared to June’s 39.92%)
- Software/Web Services: 6.35% (compared to June’s 12.42%)

DNS: Traffic up, record DDoS attack, and surge in RP queries.
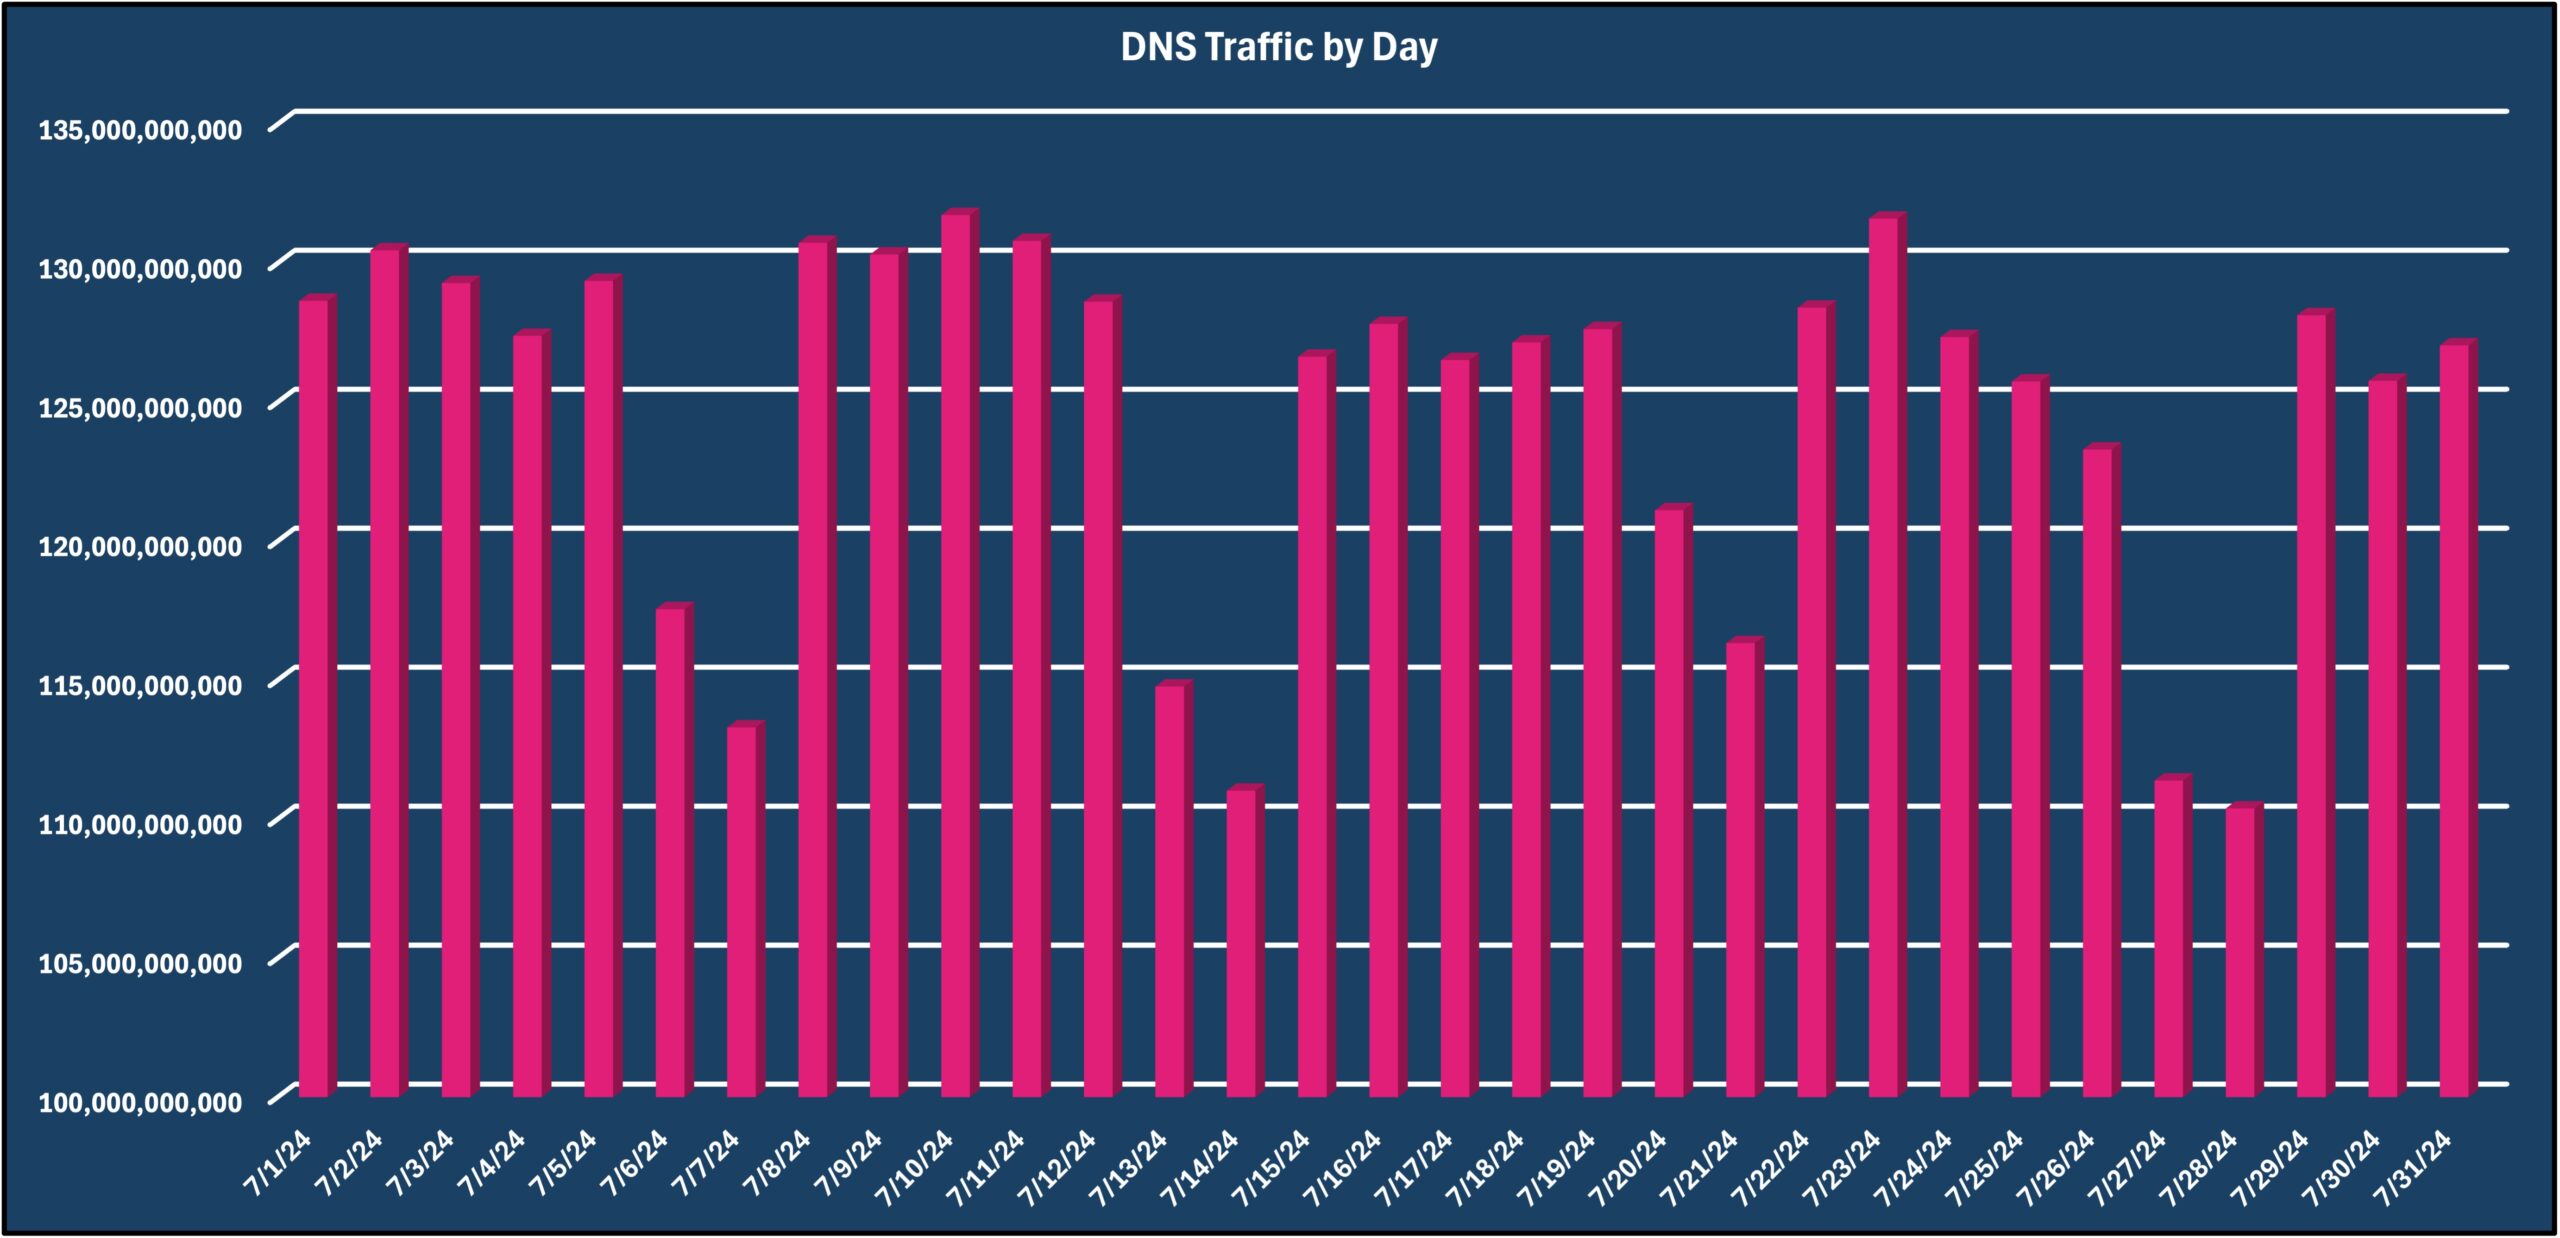
As a longer month compared to June, Vercara Managed DNS noted a 3% increase in overall web traffic for July. However, the daily queries remain statistically unchanged.

While Vercara’s UltraDNS saw only 110 DDoS attacks targeted against the platform in July compared to June’s 528, it experienced the largest DDoS attack against the platform for 2024, over 290 Gigabits-per-Second (Gbps) lasting a little over an hour. Of note, these attacks do not include smaller ones that the platform automatically mitigated.
See the DNS Analysis report for more details.
DNS Record Trends.
Overall, July followed in June’s footsteps with the Top 3 DNS Query types:
- A Record
- AAAA record (quad-A)
- Name Server (NS)
The quad-A record queries indicate a continued shift toward IPv6 and its additional security benefits.
Notably, the Responsible Person (RP) record, which specifies the email addresses of the domain’s owners, saw a 1,389.02% month-over-month increase.
DNS Response Codes.
The top two response codes remained the same month-over-month:
- “No Error”: 77.87%, a 4.4% increase from June
- “NXDomain”: 21.69%, a 1.07% increase from June

The NX Domain response code can indicate a misconfiguration or attackers using DNS enumeration tools that can cause a DDoS attack.
Notably, the SERVFAIL response code, broadly signifying resolver difficulties in the resolution process and including more than security policies, experienced a 193.33% increase compared to June.
Industry Sectors.
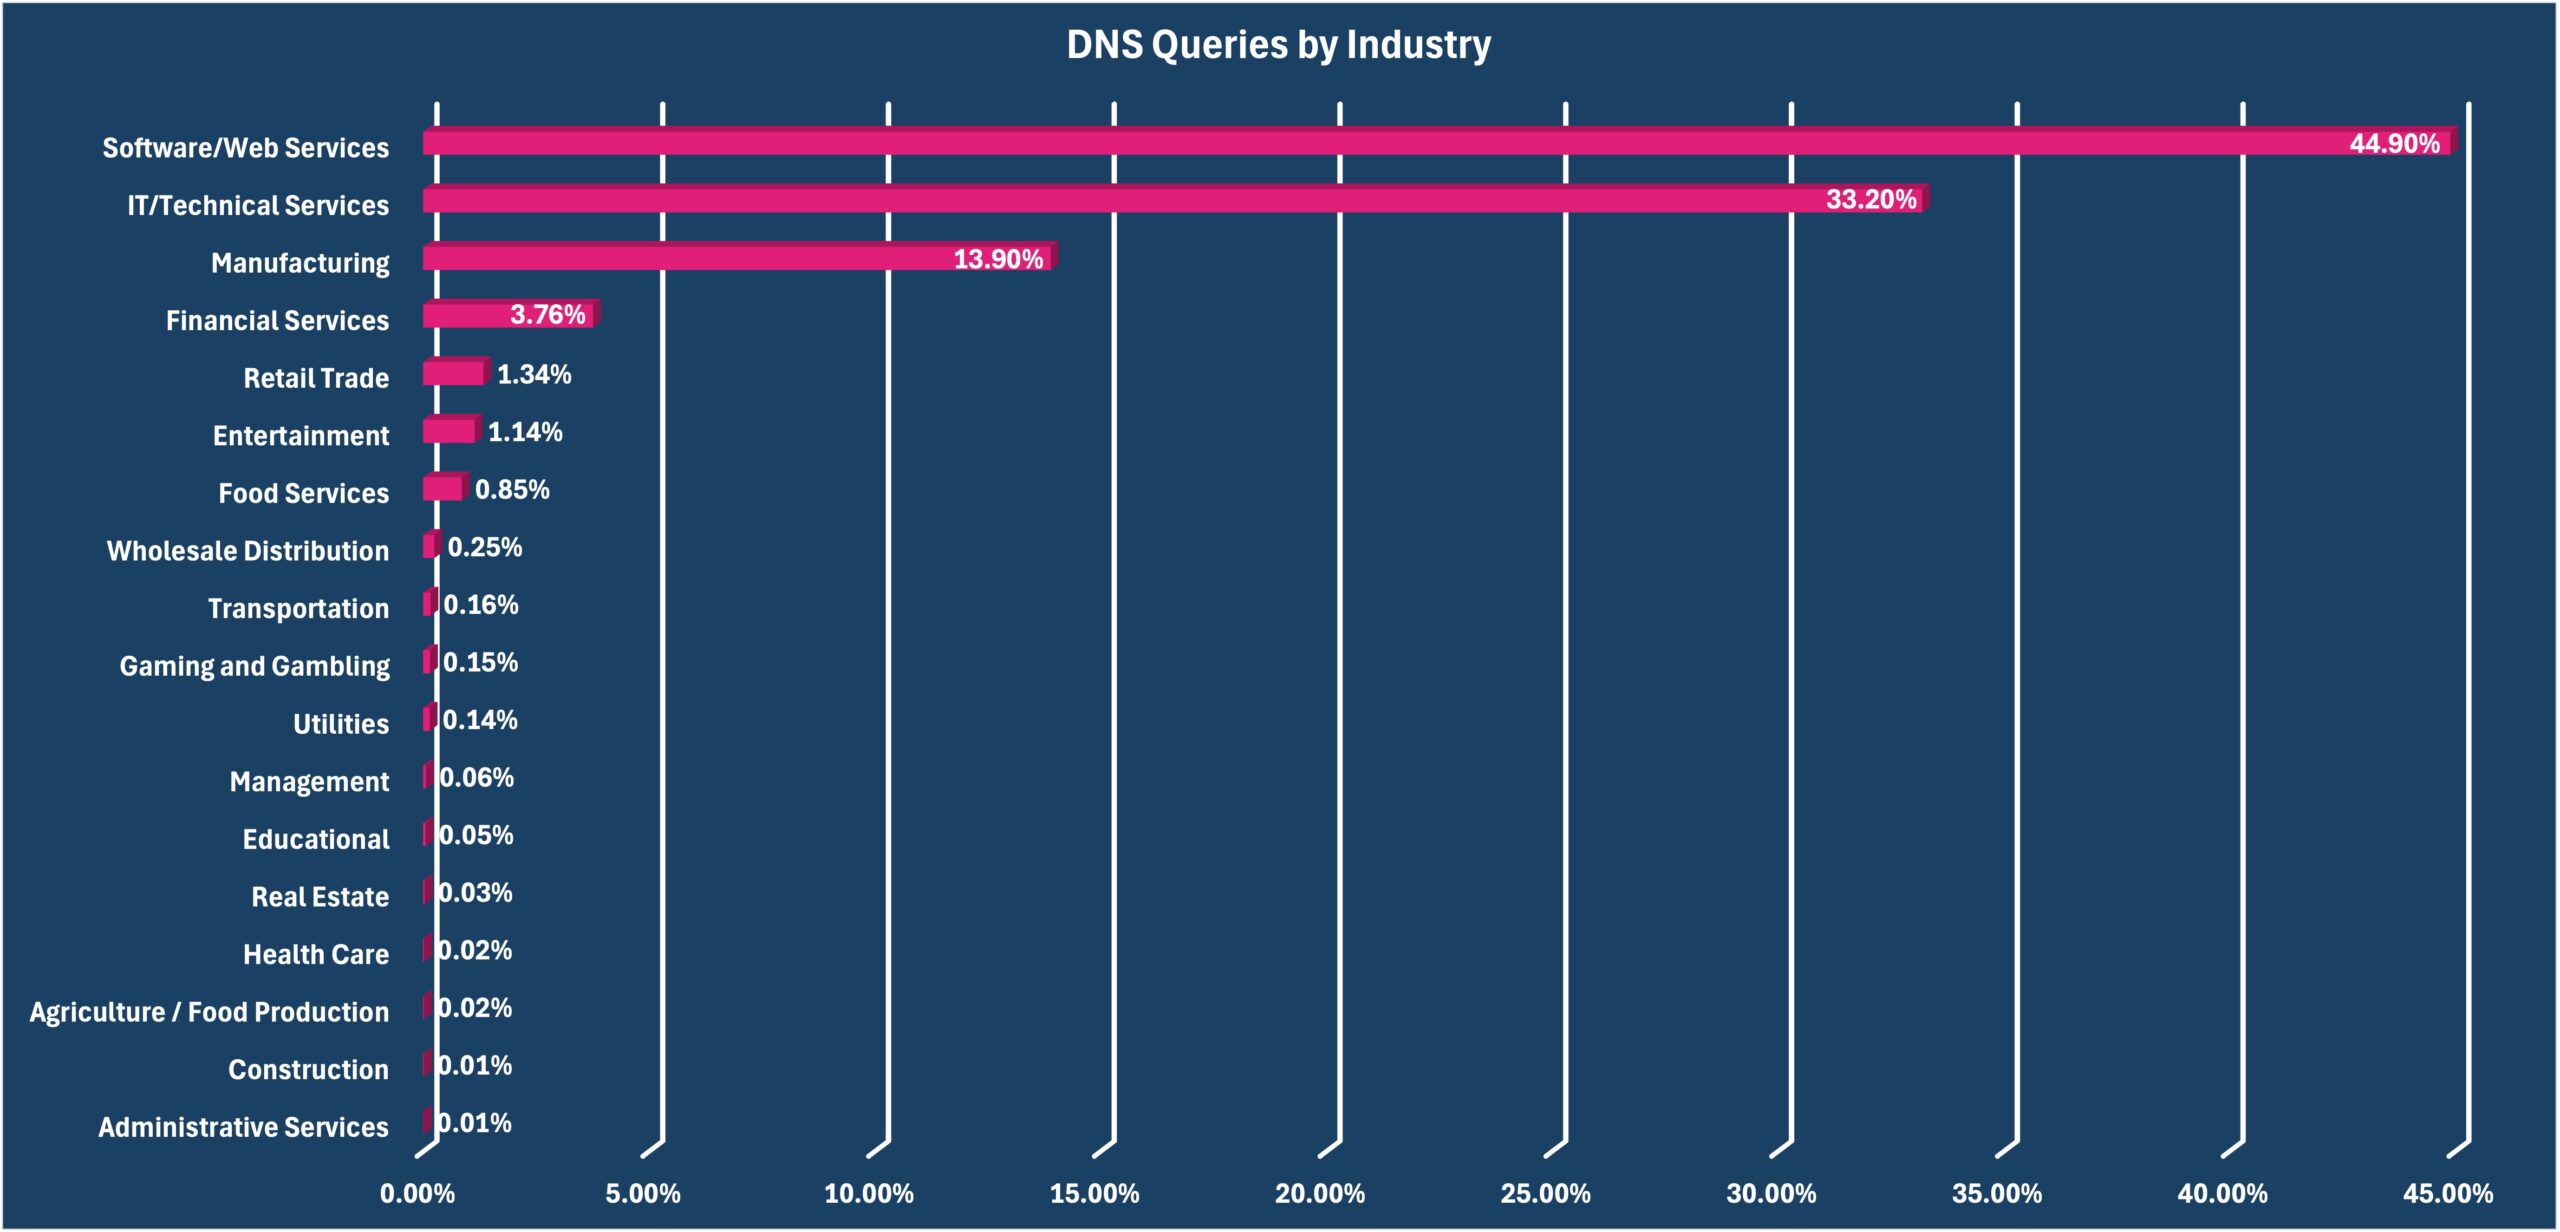
Industry sectors continue to work on and improve their DNS management, with July’s report showing both wins and areas for improvement.

Education, manufacturing, and software/web services.
These three industries show significant “No Error” rates, which indicate effective DNS management. Interestingly, the June report noted that Education focused on the HTTP resource record, and these new findings offer insight into that value.
Administrative services and construction.
These two industries saw the NXDomain response code as their most prominent one. These responses can arise from:
- Misconfigurations
- DNS enumeration tools
- Certain types of DDoS attacks
Members of these industries may want to review their configurations and continue to monitor their digital infrastructure.
Web Application Firewall (WAF): Bots, bots, and more bots.
July continued the month-over-month trend for decreased volume of web requests. However, unlike previous months, Vercara UltraWAF found some additional notable decreases.
See the WAF Analysis report for more details.
The good news.
July’s data is notable for several reasons, including:
- 42.53% decrease in malicious activity compared to June
- 18.91% decrease in the amount of bot traffic compared to June
The not-so-good news.
While malicious activity decreased overall, July was not entirely full of positivity:
- Command injection threats accounted for over 41.33% of all malicious traffic for the first time in 2024
- Post Body Limit threat category saw an increase of 180% compared to June
Post Body Limit category monitors for and mitigates web attack risks that overwhelm the web server with too many requests, often leading to a service outage.
Coming in second and third to the Command Injection threat category were:
- Cookie threat accounting for 18.9% of observed malicious traffic
- Invalid RFC threat accounting for 17.31%
Washing the Digital Hands.
Cyber hygiene remains critical. The 400 Response category experienced an 86.38% increase. Since this is related to client-side issues, the data indicates that organizations need to remain vigilant about API hygiene to mitigate risks and implement countermeasures like:
- Detecting large URLS to mitigate Buffer Overflow Risks
- Limiting request sizes to mitigate SQL injection and command injection attacks.
June Countermeasure of the month.
Over the last month, Vercara WAF discovered high volumes of requests to “/AutoDiscover/autodiscover.xml” coming from Microsoft Office. Although this can arise from a Microsoft Outlook autodiscover process, attackers can use this to discover additional hosts to attack. Inside the Deny URL countermeasure, WAF administrators can block specific URIs with a regular expression.
Turnkey Cloud-based Security with Vercara.
Vercara provides a turnkey, multilayered approach to security with UltraDNS, UltraDDoS, and UltraWAF, standalone or bundled as UltraSecure. With Vercara’s comprehensive suite of solutions, organizations gain advanced security capabilities, insights for informed decision-making, and improved resilience against cyber threats.
To learn how Vercara’s suite of solutions can help defend your organization, contact our sales team.

