Organizations increasingly rely on their internet-facing applications and the digital infrastructure that supports them to maintain their revenue and business operations. However, attacks against digital infrastructure and scaling with user demand continue to challenge IT and security teams. This monthly roundup of reports provides information to help defenders manage their applications and infrastructure.
Every month, Vercara reports on trends across three critical infrastructure domains:
- Distributed Denial of Service (DDoS) attacks
- Domain Name Service (DNS) traffic
- Web Application Firewall (WAF) attacks
DDoS: Strong and steady.
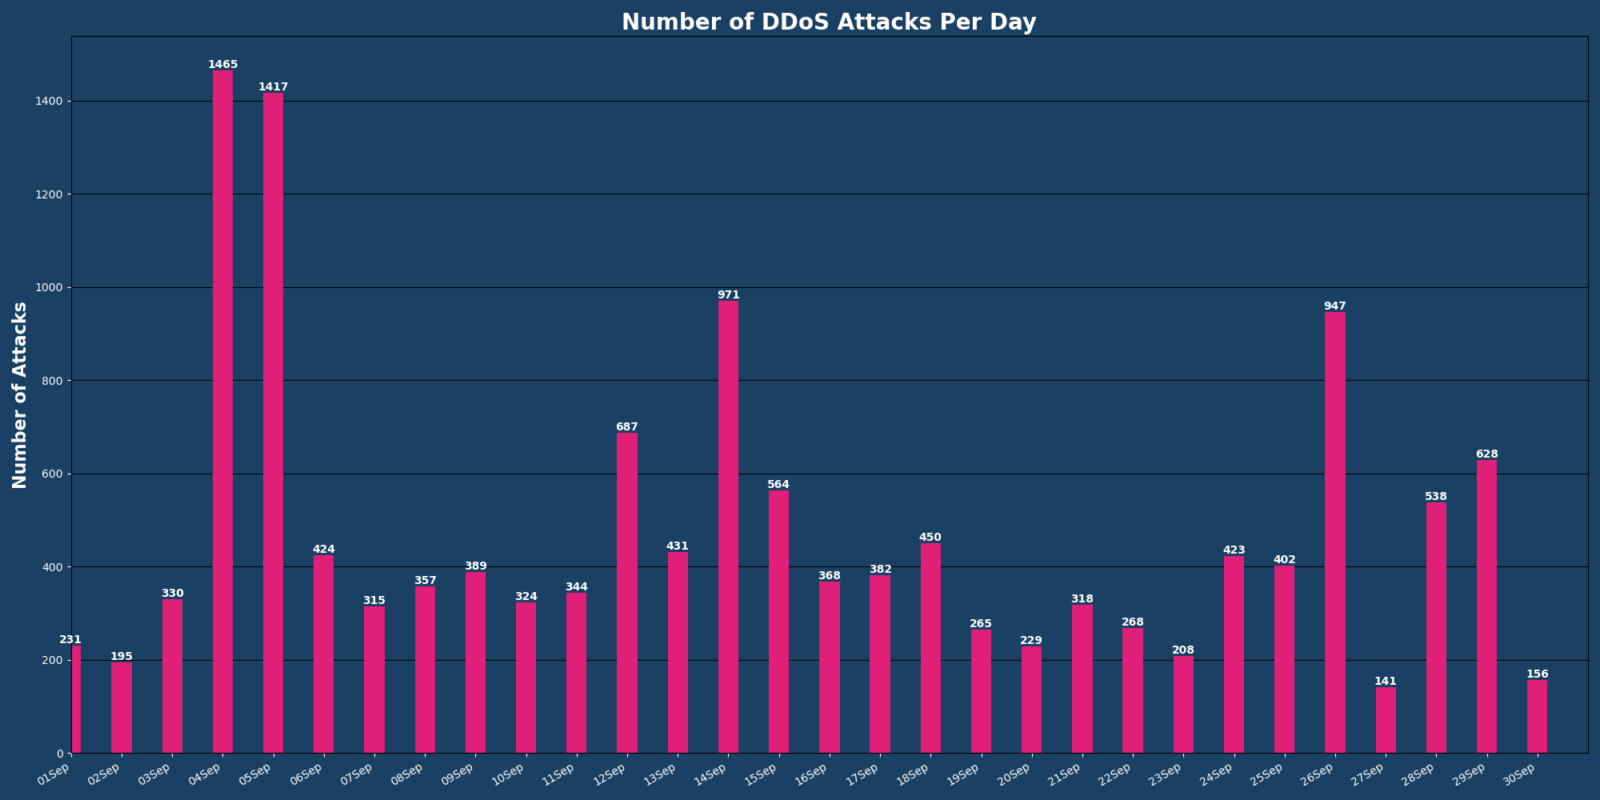
Overall, DDoS attacks saw a substantial 40% month-over-month increase, especially regarding carpet bombing attacks. Of the data gathered, the following highlights offer insights:
- 14,167 DDoS attacks detected, with Vercara’s monitoring and mitigation preventing approximately 5,230 hours of downtime
- 86.41% month-over-month increase in carpet bomb-style attacks

For more details, see the DDoS Analysis report.
Carpet bombing holds steady.
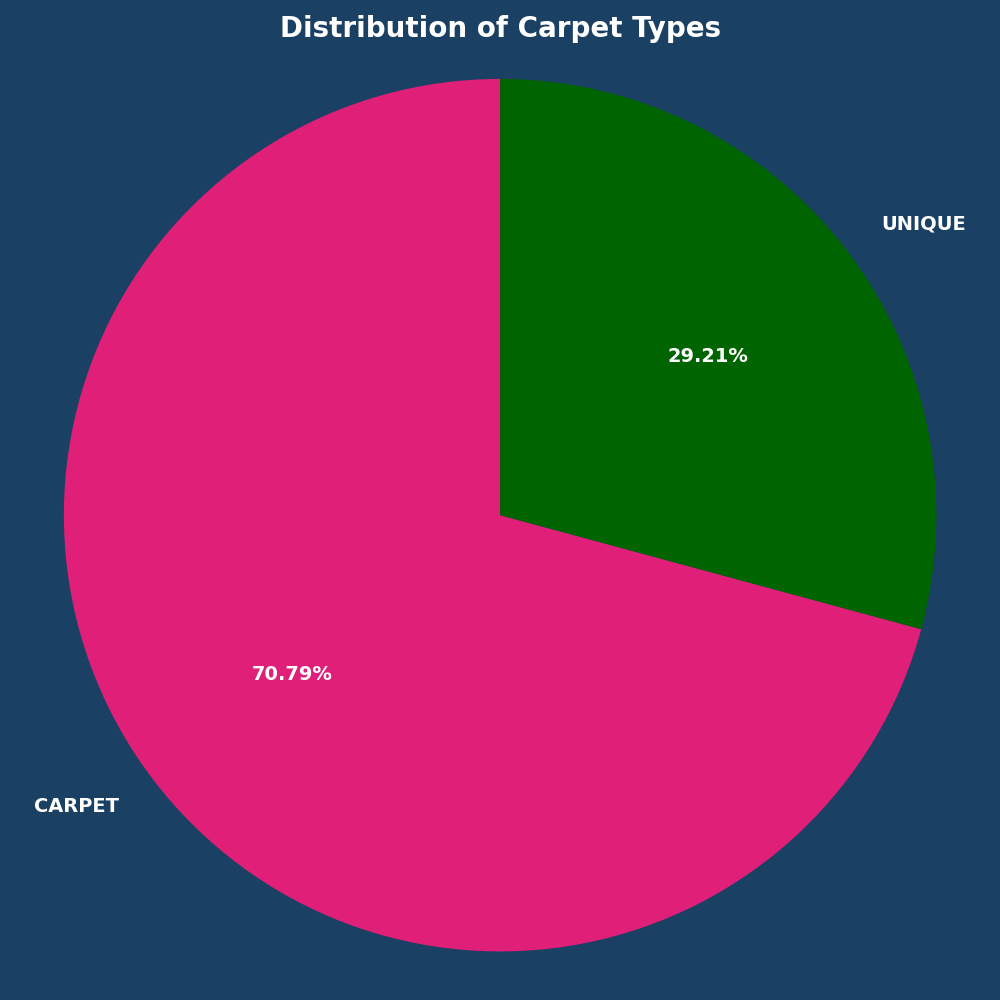
In carpet bombing DDoS attacks, malicious actors target numerous IP addresses with smaller sized attacks to evade detection, making mitigation more difficult. Carpet bombing attacks accounted for 70% of all September DDoS attacks, a substantial increase compared to August’s 53%.

While carpet bombing attacks saw a significant increase, mega attacks experienced an almost equally significant month-over-month decrease:
- Small attacks (0-0.5 Gbps): +89.88%
- Mega Attacks (100+ Gbps): -60.94%
| Gigabit-per-second | ||
| Gbps | Total Count | % |
| 0-0.5 | 10,922 | 77.17% |
| 0.5-1 | 1,411 | 9.97% |
| 1-5 | 1,221 | 8.63% |
| 5-10 | 209 | 1.48% |
| 10-50 | 268 | 1.89% |
| 50-100 | 72 | 0.51% |
| 100+ | 50 | 0.35% |
Since most organizations typically set alert triggers at higher gigabit levels, carpet bombing DDoS attacks create mitigation challenges because the threat actors:
- Remain under alerting thresholds
- Flood networks
- Rotate target IPs and destinations
- Rotate targeting method
The biggest carpet bomb-style DDoS attack observed in September occurred on September 4th, consisting of around 1,047 small DDoS waves that lasted almost 16 hours. The second biggest carpet bomb-style DDoS attack observed was also on September 4th, and this wave consisted of around 950 small DDoS waves, which lasted almost 10 hours. On September 14th, one carpet bomb attack lasted over 18 hours and consisted of approximately 847 small DDoS waves.
Top 3 attack vectors bring some surprises.
Total Traffic as an attack vector maintained its number one spot, with ICMP taking second and UDP in third place. DNS Amplification came in fourth.
The top four attack vectors for September were:
- Total Traffic: 28.10% (compared to August’s 39.25%)
- ICMP: 22.12% (compared to August’s 8.41%)
- UDP: 17.9% (compared to August’s 12.70%)
- DNS Amplification: 6.71%.
Of note, 76.42% of observed attacks consisted of one DDoS vector.
Top 3 industries.
Financial Services remained the most targeted industry while Software/Web Services and Communication Service Providers swapped spots compared to August 2024, with September’s top three industries by percentage of events becoming:
- Financial Services: 32.20% (compared to August’s 33.68%%)
- Software/Web Services: 28.13% (compared to August’s 11.47%)
- Communication service providers: 18.22% (compared to August’s 27.74%)

DNS: Small shifts offer larger insights.
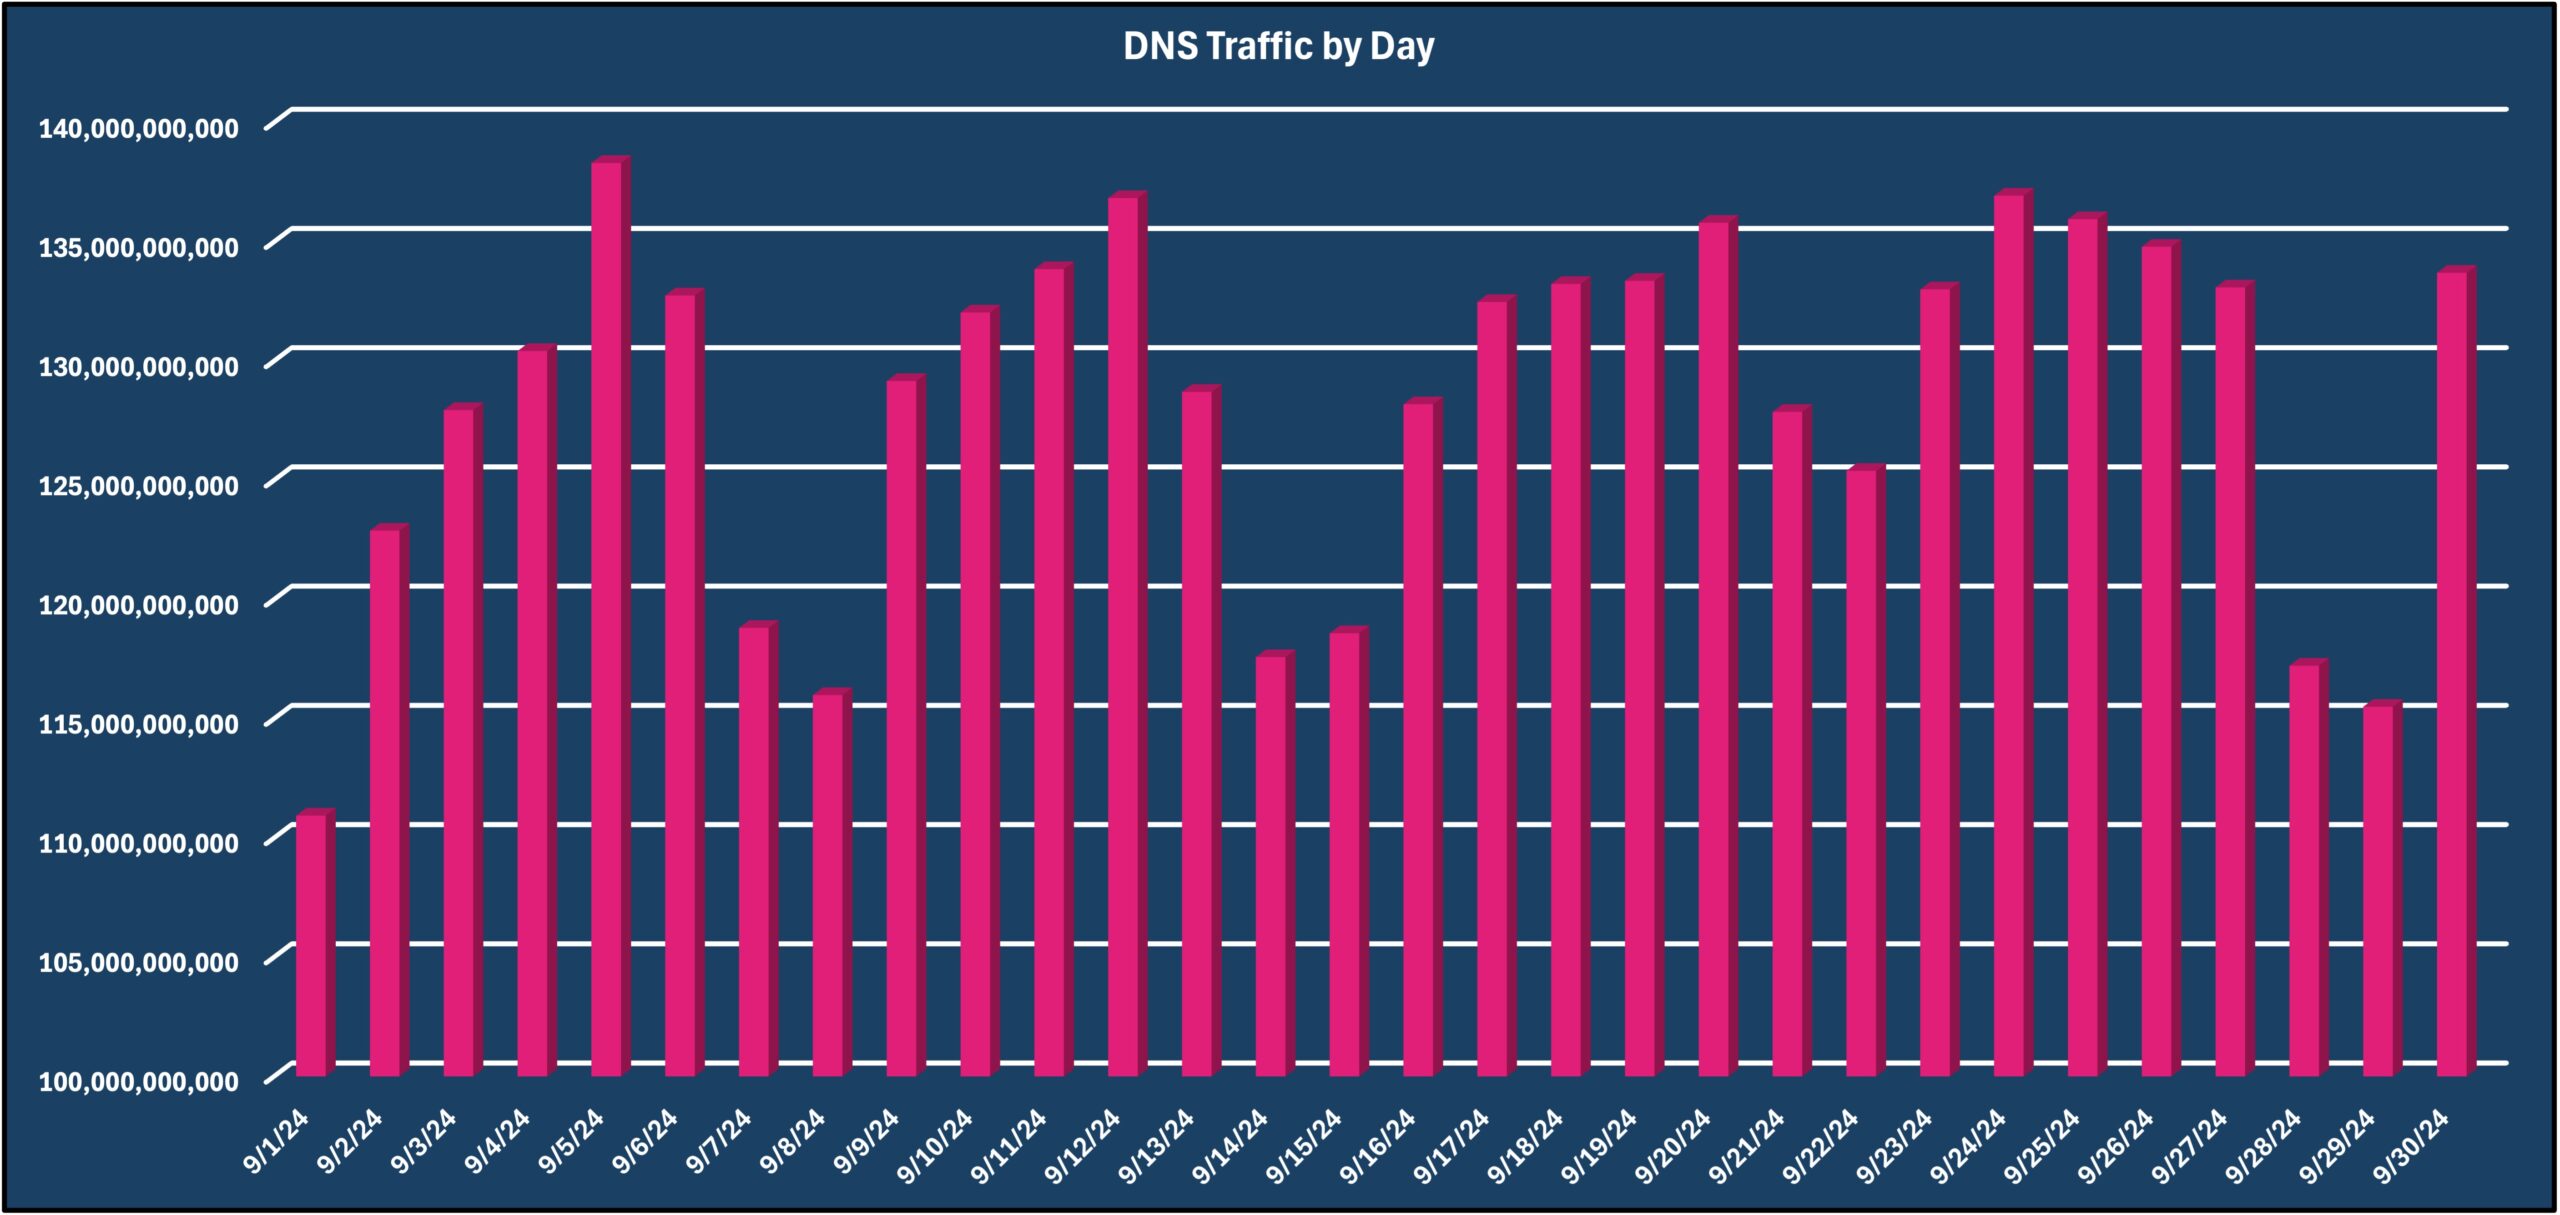
Despite being a shorter month than August, Vercara Managed DNS noted a 0.66% increase in overall web traffic for September. However, the daily queries remain statistically unchanged.

For more details, see the current DNS Analysis report. For details on the September traffic, see the DNS Analysis report for August.
Vercara’s UltraDNS observed 157 DDoS attacks targeted against the platform in September, a 45.37% increase compared to August’s 108. On September 16th, Vercara’s platform faced 50 DDoS attacks, an unprecedented surge of 630% compared to the daily average.
IPv6 Trends.
Overall, September followed in August’s footsteps with the Top 3 DNS Query types:
- A Record
- AAAA record (quad-A)
- Name Server (NS)
The consistent percentage of quad-A record queries indicates a continued shift toward IPv6 and its additional security benefits.
Notably, the IPSECKEY record saw a 5,262.4% increase compared to August. As this record stores information about IPsec gateway in DNS and allows DNS to facilitate IPsec keying and communication, this shift indicates that organizations increasingly adopt more secure network security protocols.
DNS response codes remain statistically stable.
The top two response codes remained the same month-over-month:
- “No Error”: most prevalent response code at 77.06%, a .57% month-over-month decrease
- “NXDomain”: 22.45%, a 4.91% month-over-month increase
The NX Domain response code can indicate a misconfiguration or attackers using DNS enumeration tools that can cause a DDoS attack.
Industry sectors.
Industry sectors continue to work on and improve their DNS management, with September’s report showing both wins and areas for improvement.

Software/Web Services and IT/Technical Services.
These two industries received the most DNS queries, representing 78.66% of all DNS queries. The number indicates the sectors’ extensive reliance on robust DNS services for:
- Web hosting
- Cloud services
- Technical operations
Additionally, the Software/Web Services industry had a significant presence of ‘No Error’ responses, indicating effective DNS management.
Manufacturing.
This industry accounted for 13.48% of all DNS queries, noting the sector’s reliance on DNS for maintaining service availability. This industry also had a significant presence of ‘No Error’ responses, indicating effective DNS management.
Web Application Firewall (WAF): Back to reality.
During September, Vercara UltraWAF processed over 599 million web requests, a 13% decrease compared to August. Of these requests, 13.32% were malicious, and 2.76% were identified as bot traffic.
For more details, see the WAF Analysis report.
On the up and up.
September’s data found:
- 54.58% decrease in malicious activity compared to August
- 31.62% increase in the amount of bot traffic compared to August

Some position switching.
Along with these overall increases, September showed additional changes:
- Cookie threat category took the number one spot, accounting for 43.3% of malicious traffic
- Command Injection came in second, accounting for 27.59% of malicious traffic
- Invalid RFC threat came in third, accountaccounting for 14.93% of malicious traffic, an 18.52% from increase from August to September.
September Countermeasure of the Month.
This month, the HTML-based Cross-Site Scripting (HTML XSS) countermeasure will be featured. This focuses on identifying instances where an input in a form field or HTTP header contains browser scripting.
For example, one common XSS attack adds “<script> alert(XSS!”);</script>” tags to look for reflective XSS vulnerabilities.
Turnkey cloud-based security with Vercara.
Vercara provides a turnkey, multilayered approach to security with UltraDNS, UltraDDoS, and UltraWAF. With Vercara’s comprehensive suite of solutions, organizations gain advanced security capabilities, insights for informed decision-making, and improved resilience against cyber threats.
Contact our sales team to learn how Vercara’s suite of solutions can help defend your organization.


